Ottawa Neighbourhood Guide
Use the guide below to search homes for sale in Ottawa and surrounding communities. Each of these pages contains the active real estate listings for that area, updated every day. If you already know which communities you like, be sure to sign up for email alerts of new listings as soon as they hit the market -- it's fast, easy, automatic and FREE!
Search All Area Listings
Featured Communities
Ottawa Central
Ottawa East
Ottawa South
Ottawa West
Cumberland Township
Gloucester
Stittsville, Goulbourn & Areas
Kanata
Nepean
Osgoode

Ottawa’s MLS® Market Thawed in January but Sales Still Slow
Ottawa’s MLS® Market Thawed in January but Sales Still Slow
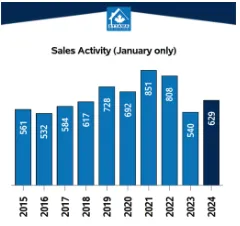
The number of homes sold through the MLS® System of the Ottawa Real Estate Board totaled 629 units in January 2024. This was an increase of 16.5% from January 2023.
Home sales were 10.7% below the five-year average and 3.9% below the 10-year average for the month of January.
“Ottawa’s market activity is seeing positive gains over last year but it’s still a relatively quiet market even by pre-pandemic standards,” says OREB President Curtis Fillier. “While REALTORS® are telling us there’s lots of showing activity — probably thanks in part to the forgiving winter thus far — it’s not all translating to sales. This tells us that buyers are back out there looking, but still approaching cautiously. During the pandemic market, buyers had to move quickly and sometimes settle for a property that didn’t check all their boxes. Today, buyers are using the slower market to take the time needed to find their perfect place. Sellers would be well-advised to adjust their expectations and thoughtfully consider their pricing and timing strategy using the negotiating expertise and hyper-local data their REALTOR® can provide.”
“Ottawa’s market conditions can fluctuate quickly, though, because our supply is chronically low,” adds Brandon Reay, OREB’s policy and external relations manager. “Ottawa needs more suitable and affordable homes to address the housing crisis, and we need to increase density to meet population demands. We can’t restore and grow upon the market activity Ottawa saw five and ten years ago without more houses for people to buy. OREB recommends direct solutions for meaningful policy change, including streamlining the process at the Ontario Land Tribunal, eliminating exclusionary zoning, and permitting four units on residential lots. To meet the aggressive housing targets, we need to close the labour gap with investments in colleges and trade schools. We don’t need any more reactionary and distracting policy, like the federal government’s extension of the foreign buyers ban.
”By the Numbers – Prices:
The MLS® Home Price Index (HPI) tracks price trends far more accurately than is possible using average or median price measures.
The overall MLS® HPI composite benchmark price was $621,600 in January 2024, a gain of 3.2% from January 2023.
The benchmark price for single-family homes was $703,500, up 3.7% on a year-over-year basis in January.
By comparison, the benchmark price for a townhouse/row unit was $462,200, down 2.1% compared to a year earlier.
The benchmark apartment price was $418,500, up 3.7% from year-ago levels.
The average price of homes sold in January 2024 was $631,722, increasing 1.8% from January 2023.
The dollar volume of all home sales in January 2024 was $397.3 million, up 18.6% from the same month in 2023.
OREB cautions that the average sale price can be useful in establishing trends over time but should not be used as an indicator that specific properties have increased or decreased in value. The calculation of the average sale price is based on the total dollar volume of all properties sold. Price will vary from neighbourhood to neighbourhood.
By the Numbers – Inventory & New Listings:
The number of new listings saw an increase of 7.3% from January 2023. There were 1,271 new residential listings in January 2024. New listings were 17.5% above the five-year average and 0.8% above the 10-year average for the month of January.
Active residential listings numbered 1,961 units on the market at the end of January 2024, a gain of 4.5% from the end of January 2023.
Active listings were 57.4% above the five-year average and 16.6% below the 10-year average for the month of January. Months of inventory numbered 3.1 at the end of January 2024, down from the 3.5 months recorded at the end of January 2023. The number of months of inventory is the number of months it would take to sell current inventories at the current rate of sales activity.
Ready to Start?
Select Real Estate
Corinne Campbell & Kim Ziebell
REALTOR®, Brokers
(613) 701-9490
202-435 St Laurent BLVD

Contact Us

